Golf Science - A man golfing

HEALTH SCIENCE

Many of the personal health and activity insights offered by Garmin wearables come directly from or by analyzing heart rate data. This includes features such as all-day stress tracking, Body Battery™ energy monitoring, respiration rate, sleep tracking and even how many calories you burn. Your heart rate can also reveal details of your cardiorespiratory fitness, measured in terms of VO2 max, when paired with walking speed, running speed or cycling power data (on compatible devices).

Heart Rate

What is heart rate and what can it tell us?

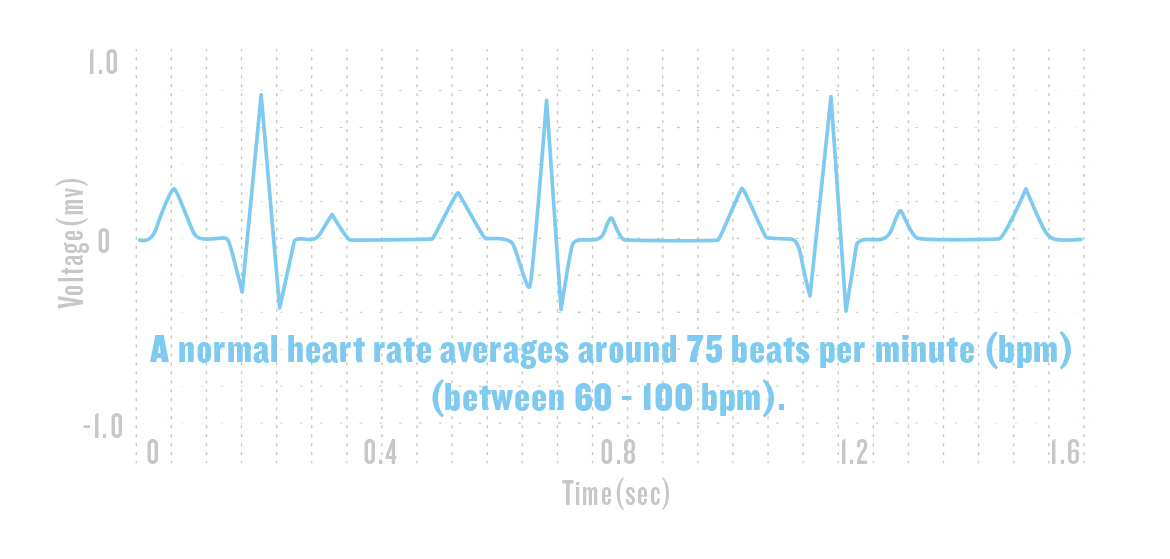
Heart rate is the number of heart beats per minute. Tracking heart rate is a clear and convenient way to measure exercise intensity and get insights into your health. One of the body's most important vital signs, heart rate differs due to factors such as age, gender and other physical characteristics. One of the body's most important vital signs, heart rate differs due to factors such as age, gender and other physical characteristics. Generally, a normal at rest adult heart rate averages around 75 beats per minute (bpm) (between 60 - 100 bpm).


Resting Heart Rate (RHR) and Maximum Heart Rate (HRmax)

RHR and HRmax are essentially the lower and upper limits of your HR. They are both important for various reasons. However, despite some similarities, each needs to be considered separately.

Your RHR changes from day to day. The RHR of normal adults can vary anywhere between 60 and 100 bpm, and some athletes can see an even lower range than that. Typically, a lower RHR reflects good cardiorespiratory fitness levels (VO2 max), adequate sleep, low stress and abstention from stimulants such as alcohol and tobacco.

Your HRmax is the fastest your heart can beat. Unlike RHR, your HRmax doesn’t change from one day to the next. It is also almost entirely unaffected by your fitness level, so getting into great shape won’t increase your HRmax.

Your maximum heart rate is relatively stable and declines slowly as you get older. This is different from your resting heart rate, which reflects changes in fitness, recovery status and dietary choices.

Everyone’s physiology is unique, and that includes your heart. Some naturally beat a bit faster than others, and some are a bit slower. As a rule, however, your HRmax will decline as you get older. This insight is widely used to estimate an individual’s HRmax with help from the following formula: 220 – age = HRmax bpm. If you know your own true HRmax, you can enter it on your watch or in the Garmin Connect™ app.

Heart Rate Variability (HRV)

Do you know your heart beat does not always keep a steady rhythm?

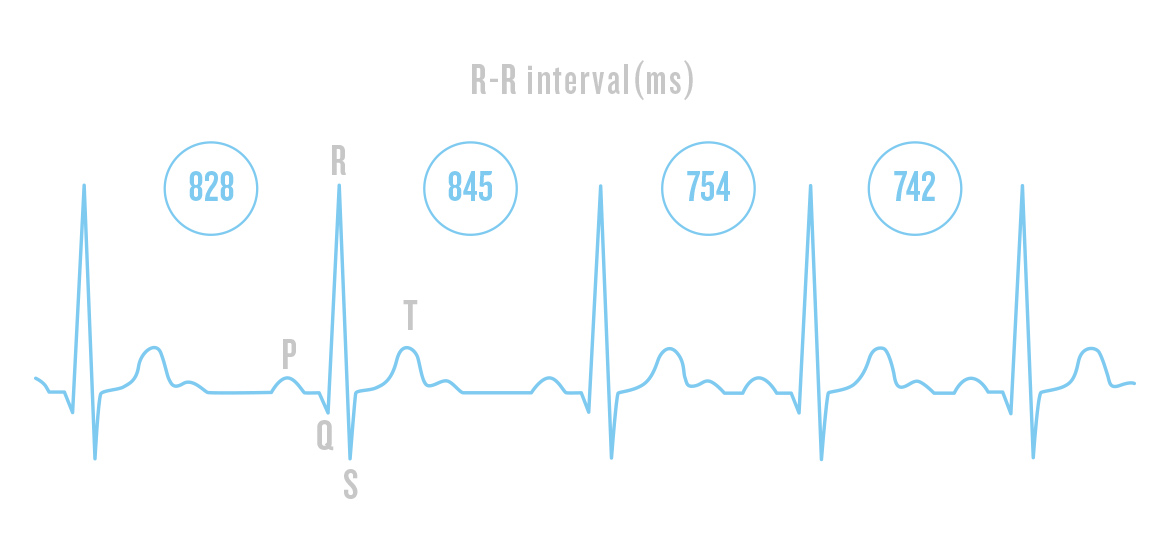
Heart Rate Variability (HRV) is the variation in time / interval between each heartbeat.

Your heart doesn't keep a steady beat like a metronome. Actually, variation in heart beat is normal and healthy. HRV data can be used to measure physical indicators such as stress, body battery, maximum oxygen consumption (VO2 max) and lactate threshold. Devices equipped with Garmin's optical heart rate technology can also use HRV to assess your sleep quality.


To understanding how Garmin use HRV to provide accurate health information to users, the key is to know why our heart rate changes in different circumstances.

The heart is controlled by the autonomic nervous system (ANS), which governs bodily functions not under conscious control. The ANS has two major parts: the sympathetic nervous system and the parasympathetic nervous system. When you experience stress, the sympathetic nervous system becomes active. It sets the ANS in a state of alertness. Conversely, the parasympathetic nervous system operates when the body is at rest and free of danger, humming away in a more relaxed fashion. That means that when the sympathetic nervous system is engaged, your heart rate will usually increase and it will beat to a more consistent tempo. This corresponds to a decrease in heart rate variability.

By contrast, when the parasympathetic nervous system is active, your heart rate slows down. When your body physical needs have been met, your heart doesn't need to beat as frequently, and each beat is less regular and distinct than when under stressful conditions. In other words, your heart rate variabilty has increased. Because of this connection, measuring HRV is an ideal way to track the interplay between the two parts of your autonomic nervous system and assess your body's stress levels. Higher HRV signifies lower stress.

How does Garmin detect heart rate?

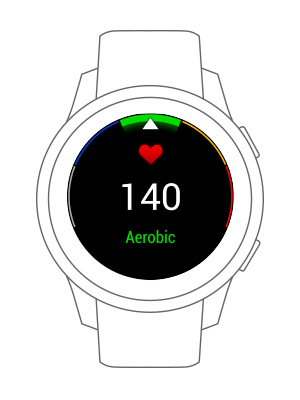
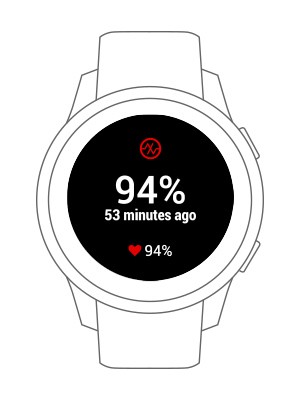
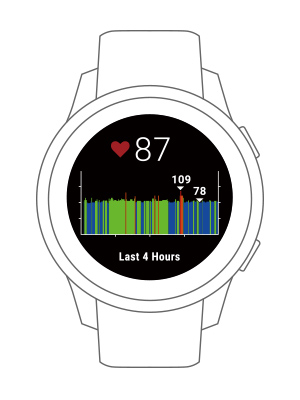
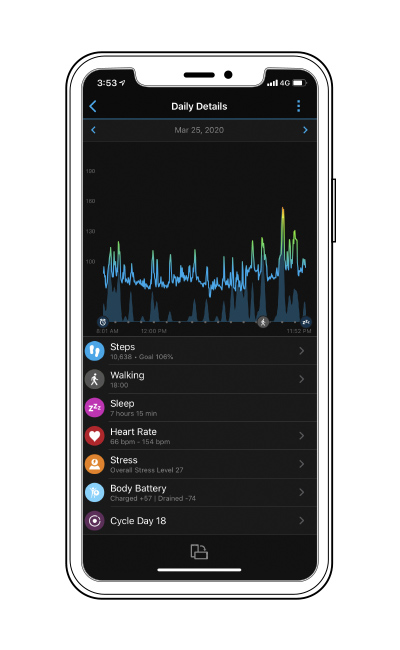
By wearing a device equipped with Garmin Elevate optical heart rate, you can continually track your heart rate 24 hours a day. The device senses and displays your heart rate instantly in real time, and by using the Garmin Connect app you can view longer term data to identify trends and better understand your health.
Automatic Maximum Heart Rate Detection

Compatible Garmin devices can automatically update your maximum heart rate using your performance data. If a heart rate higher than your currently set maximum is identified and passes a reliability threshold, your personal maximum heart rate is updated on the device or in the Garmin Connect app.

This feature can be turned on or off in the Physiological Metrics -> Auto Detection menu of the device.


Heart Rate Zones

Heart rate zones are an easy way to see and guide the intensity of your efforts during an activity.

Personalizing your heart rate zones set the stage for improving the effectiveness of your workouts over time. Avoid overdoing it in your recovery sessions, dial in better endurance training, and instantly see when it’s time to pick up the pace for a more stimulating workout.

With compatible Garmin devices, you can customize activity-specific heart rate zones for running, cycling and swimming. These can be used in addition to the zones you configure for your general activity profile.


Using Heart Rate Zones

Heart rate zones offer insight into the current intensity of your performance. To anticipate the fitness or performance benefits of a workout, you should consider the combination of intensity, duration, recovery and repetition. This is true for specific workouts and within the broader picture of your training plan.

Heart rate zones remove the guesswork from the intensity element of that formula.

By focusing different workouts in different zones, you can create a well-rounded training regimen that helps you gain strength, endurance, power and other benefits. In general, the lower zones are best for warmup and recovery, while the higher zones lead to improvements.

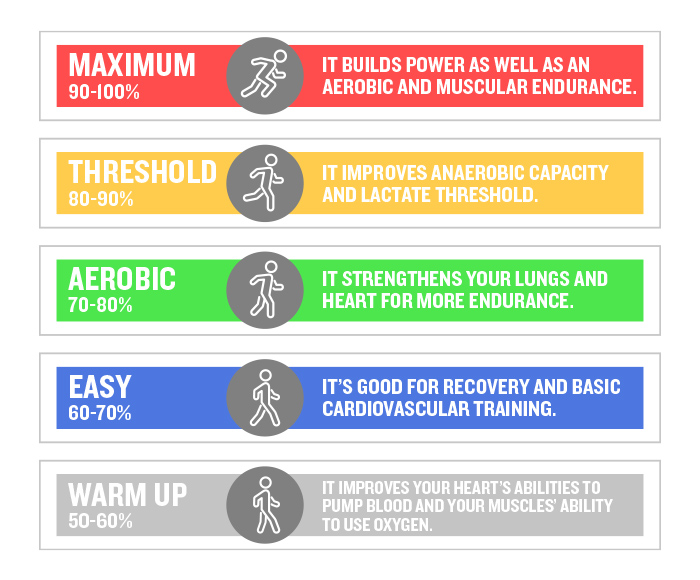
The following are descriptions of our default heart rate zones. The zones may not match these descriptions if you customize them for different training purposes.


Zone 1 (Warmup): 50–60% of Max HR
Training in zone 1 feels like a relaxed, easy pace with rhythmic breathing. It improves your heart’s abilities to pump blood and your muscles’ ability to use oxygen. Brisk walking is a typical zone 1 exercise.

Zone 2 (Easy): 60–70% of Max HR
Training in zone 2 is at a comfortable pace, where you’re breathing more deeply but can still hold a conversation. It’s good for recovery and basic cardiovascular training. Light jogging typically falls into zone 2.

Zone 3 (Aerobic): 70–80% of Max HR
Zone 3 training is done at a moderate pace, where it’s more difficult to hold a conversation. This strengthens your lungs and heart for more endurance. Easy running is done in zone 3.

Zone 4 (Threshold): 80–90% of Max HR
In zone 4, you are moving at a fast, almost uncomfortable pace with forceful breathing. It improves anaerobic capacity and lactate threshold. Fast runs fall into zone 4.

Zone 5 (Maximum): 90–100% of Max HR
When you reach zone 5, you typically are at a sprint pace that is difficult to sustain for long. Breathing is labored. Zone 5 training builds power as well as anaerobic and muscular endurance.

Respiration Rate

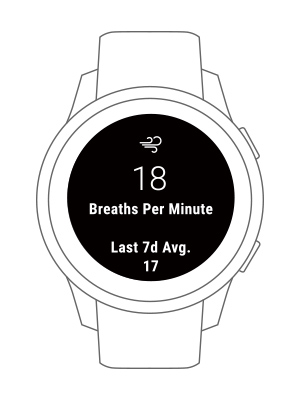
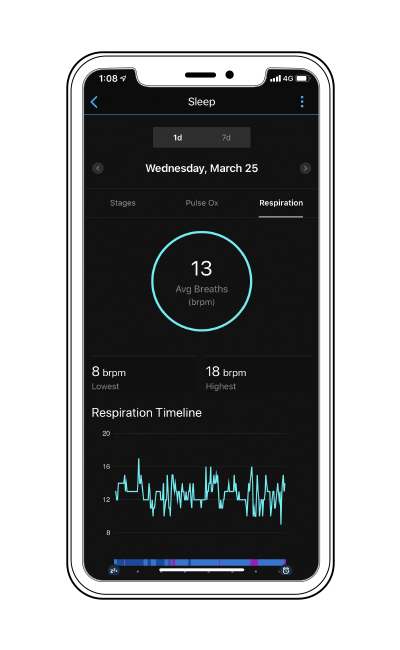
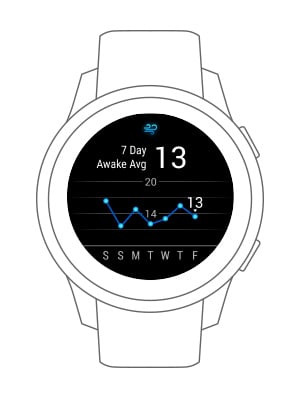
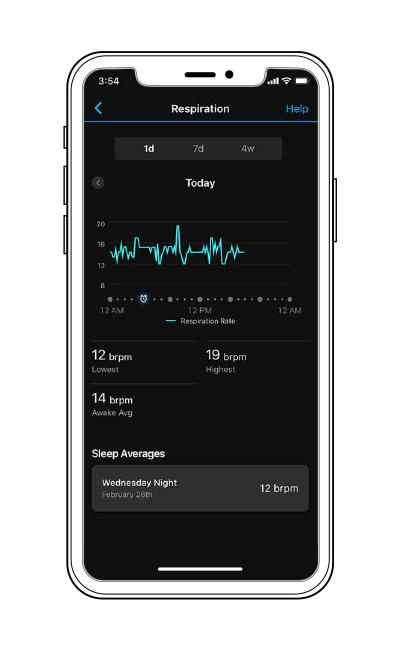
Respiration rate measures your average number of breaths each minute (brpm) over each day, tracking each inhalation and exhalation using optical pulse rate technology. A low respiration rate while your body is at rest is usually a sign of good health. An adult at rest will normally record a respiration rate of between 12 to 20 brpm.

If your respiration rate at rest is higher or lower than average, it can indicate potential health or air quality problems.

Breathwork Exercises

Whether you want to increase awareness, reduce stress, improve mental sharpness, boost work performance or prepare for sleep, breathwork — or mindful breathing — can help.

On compatible Garmin devices, you can use the built-in breathwork activity profile to practice three different breathing techniques: tranquility, coherence, and relax and focus. Here’s what you can expect when you try out each technique.

Breathwork Exercises

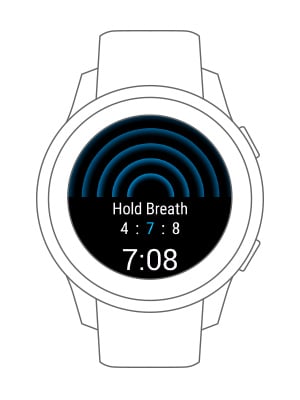
Tranquility

This is a 10-minute activity that aims to help get you in a ready state for sleep. It slowly builds up until you can inhale for 4 seconds, hold for 7 seconds and exhale for 8 seconds.

Tranquility

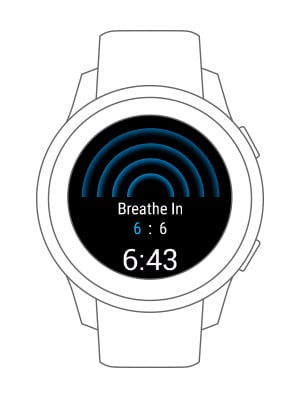
Coherence

This 15-minute activity should help you feel balanced and calm, rather than excited or overly relaxed. You will gradually slow down your breathing until you can achieve an even 6-second inhale and 6-second exhale.

Coherence

Relax and Focus

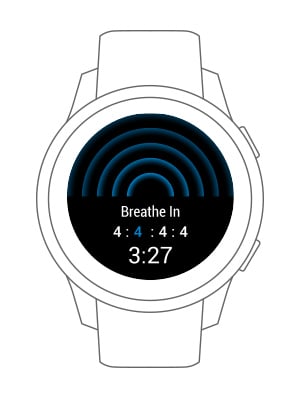
This is another 15-minute activity meant to put you in state of focus and concentration, free from stress. Sometimes referred to as “box breathing” or “fourfold breath,” this technique helps you work toward a “4:4:4:4” breathing pattern, meaning a 4-second inhale, 4-second hold, 4-second exhale and 4-second hold.

There is also a 5-minute version of this activity, which is suggested when your watch detects unusually high stress spikes and gives you a “relax reminder” alert.

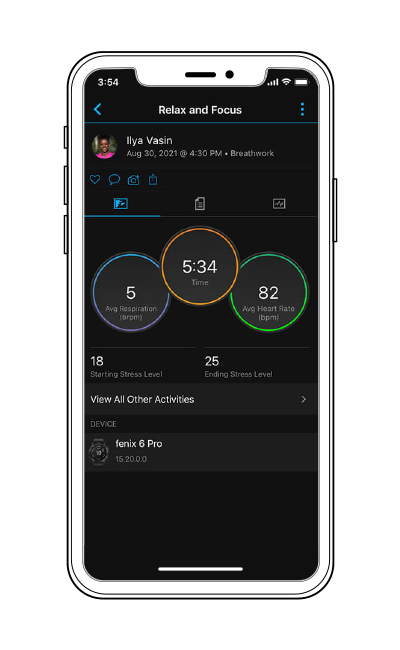
When you finish, your watch will display the duration of the activity, average heart rate during the activity and the detected change in stress from your breathwork activity. You can also review each activity in the Garmin Connect™ app to see graphs of your respiration rate, stress and heart rate during the session.

If breathwork exercises feel awkward at first, don’t give up. As you get accustomed to the patterns and learn to control your breathing better, you’ll start noticing the benefits more and more. Like any other exercise, it takes practice. But unlike many exercises, you don’t need any equipment or lessons. Just a quiet space … and maybe a pillow.

Relax and Focus

Stress Tracking

What does stress data represent?

Stress data is derived from your HRV. Stressful experiences influence our heart's activity. Generally speaking, lower HRV means your body is experiencing stress. Likewise, a higher HRV can indicate a reduction in stress levels, or that you have adapted to better handle stressful situations. Training, physical activity, sleep, nutritional intake and everyday pressures can all influence your stress levels.

Stress levels are calculated on a scale from zero to 100. A score from zero to 25 indicates low stress levels, 26 to 50 indicates medium stress levels, 51 to 75 signifies high stress levels and 76 to 100 represents extremely high stress. This function can help you understand your daily stress levels and make timely adjustments to keep stress in check.

When your stress score exceeds 50, you can…

  1. Stand up and go for a walk. Close your eyes and breath deeply.
  2. Take a break from what you are focusing on, perhaps listen to some music.
  3. Take a shower/bath or catch up on sleep to give your body a chance to recuperate.

Appropriate stress levels help us to function better, but excessive stress can be detrimental to our health. There are no definite methods for how to relieve stress, you need to try different approaches to find what works for you.

Body Battery

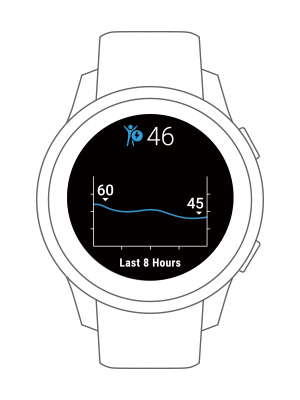
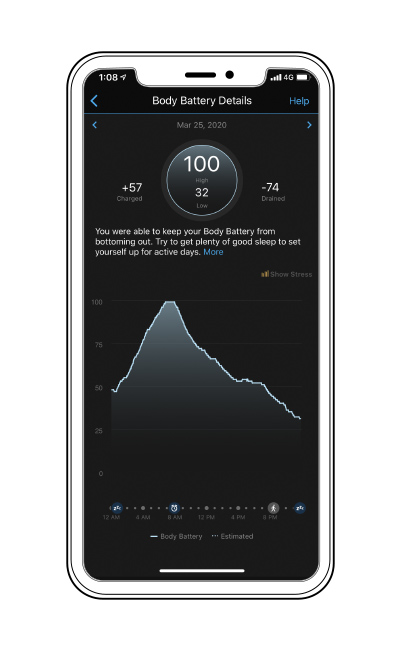
Body Battery analyzes HRV, stress levels, sleep quality and daily activity levels to gauge users' personal store of physical energy.

It is displayed using an energy scale from zero to 100. The larger the score, the larger the store of energy that you wil be able to devote to that day's activities. If the score is too low, it is a sign that you need to take a rest.

Body Battery can assist users to manage their daily activity, when your score is higher it means you have sufficient physical and mental energy to put your body to the test. When the score is lower, it might be a good idea to take a rest. Tracking your Body Battery score can help you improve your daily routines. For example, if your Body Battery is low in the morning, you can review your previous days' activity data to analyze why you are low on energy.

Pulse Ox (SpO2)

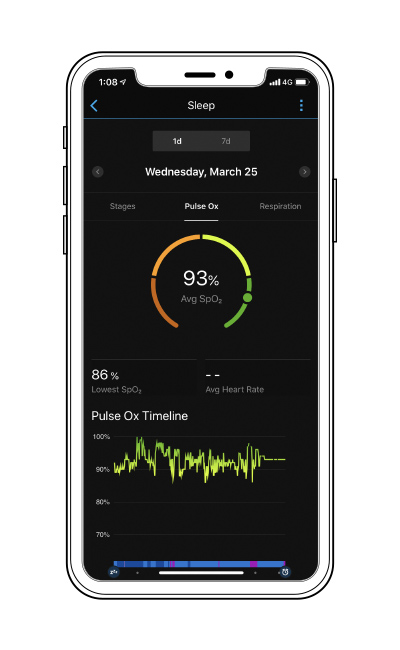
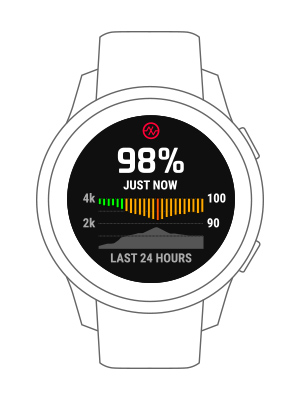
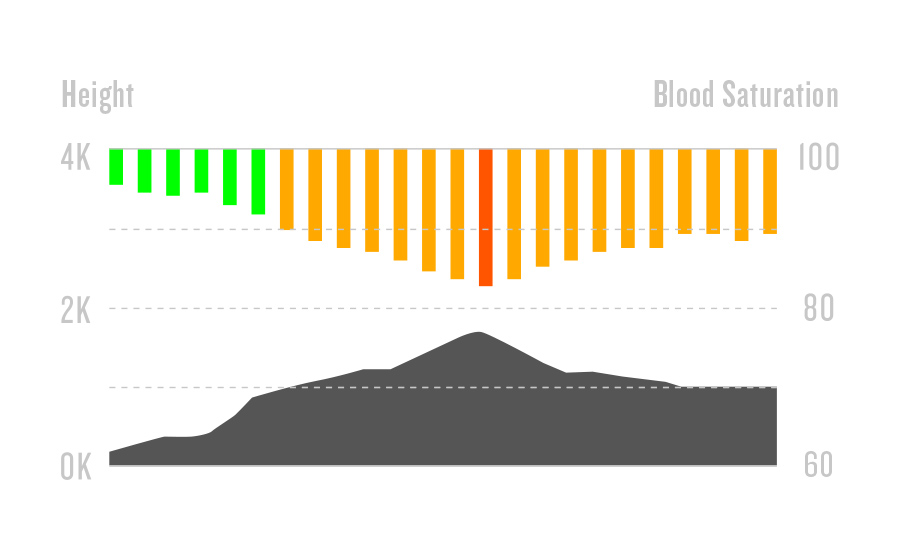
Garmin devices use Pulse Ox sensors to calculate blood oxygen saturation. Pulse Ox is one of the most reliable technologies for detecting blood oxygen saturation. Our cardiovascular system is responsible for distributing oxygen throughout our bodies. Blood oxygen saturation (Sp02) is a valuable indicator of health and physiological function. By tracking your blood oxygen saturation, you can better understand your body. According to the Mayo Clinic, a body at rest at sea level should have blood oxygen saturation between 95 to 100 per cent. Below 90 per cent is considered excessively low.

If you particpate in activities at high altitudes, SpO2 can help you to assess your body's acclimatization, and track increases or decreases in your blood oxygen saturation as your altitude changes. Monitoring changes in your SpO2 during sleep is useful for identifying sleep disorders, and tracking it while awake can provide insights into our physical performance under all kinds of conditions, helping you keep track of longer-term trends in your personal health.

P

Advanced Sleep Monitoring

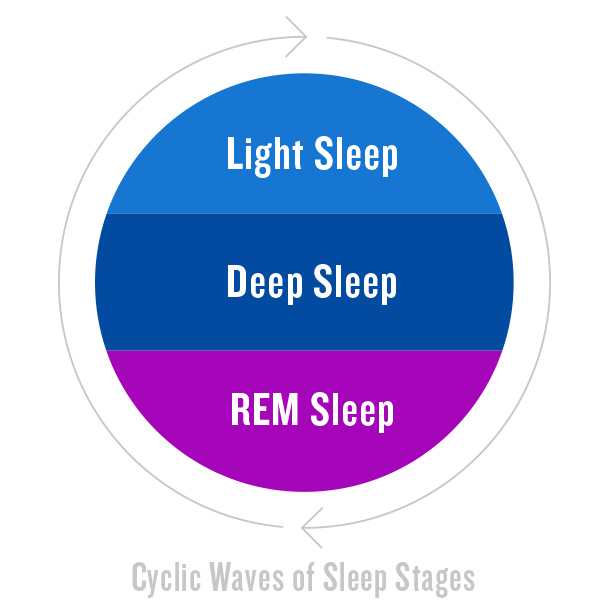
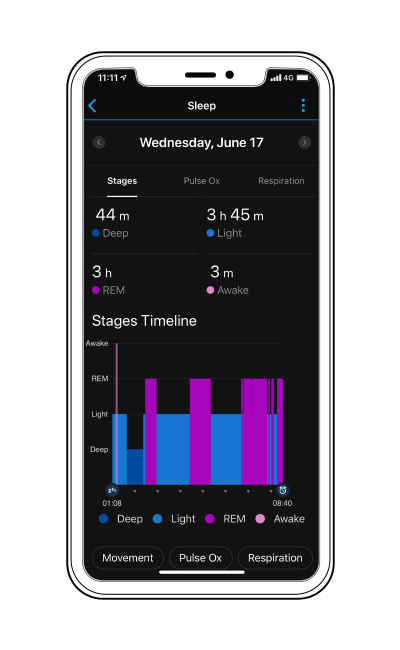
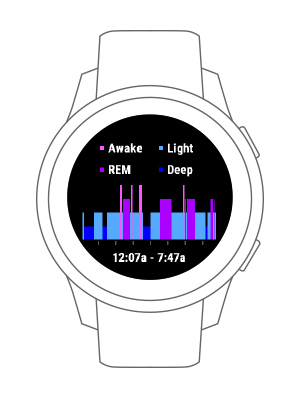
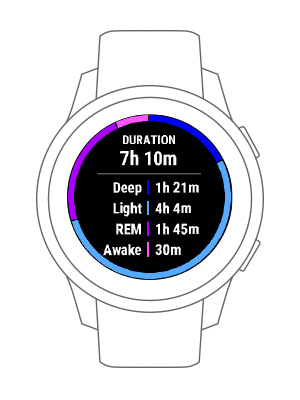
Sleep monitoring technology analyzes heart rate, HRV, blood oxygen, respiration and activity level data. Every night, you go through different sleep stages that alternate in cyclic waves: light sleep, deep sleep and REM (Rapid Eye Movement) sleep.

Stage 1. Light Sleep: As your body prepares to enter deep sleep, eye movement and muscle activity decreases. This kind of sleep helps your body relax.

Stage 2. Deep Sleep: During deep sleep, eye movement and muscle activity totally stops and your heart rate and breathing slow. Your body enters a restorative mode, building bone and muscle tissue and boosting immune function.

Stage 3. REM Sleep: As you leave deep sleep, the length of each cycle increases from shorter to longer periods. REM sleep is when we dream, a time when the brain is almost as active as when awake.
* Some devices do not support blood oxygen and respiration rate sensing.


How can you improve sleep quality?

  1. Cultivate regular sleep patterns, try to go to sleep and get up at regular times.
  2. Before sleeping, avoid stimulants and try to eat in moderate amounts. This way you can avoid indigestion or hunger pangs that can affect your sleep quality.
  3. Try to partake in some physical activity in the evening. Increasing the difference in your body temperature between daylight and night can promote deeper sleep.

Many other factors can influence sleep quality, including age, environment, shifting between time zones, your previous night's sleep quality, medication, alcohol consumption, and sleep disorders such as hypersomnia and sleep apnea.


Score Your Sleep Every Night

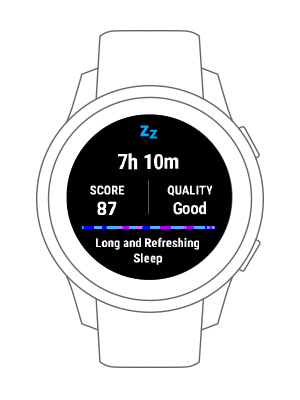
The sleep tracking widget on Garmin smartwatches analyzes the user’s HRV, respiratory rate, heart rate, body movement, and bedtime to give every night's sleep a score. The watch detects the user’s sleep quality in each phase, which includes light sleep, deep sleep, REM, and being awake. It considers the user’s physiological measurements and the training data during the day to calculate the sleep score and offer feedback. The score can be divided into 4 levels. Score 100: A very good sleep. Your bedtime is enough and your sleep is mostly restorative sleep. Score 80-99: You are sleeping well and have sufficient rest. Score 50-79: You have a moderate amount of sleep. Score 0-49: Your sleep quality should be improved. We suggest users track their sleep every day and gradually adjust your sleep routine to get a healthy amount of rest. To get a more accurate score, it is recommended that users wear the watch on the wrist all day.
* The sleep score widget feature is only available on fēnix 6 and MARQ series.

Women’s Health

Menstrual Cycle Tracking

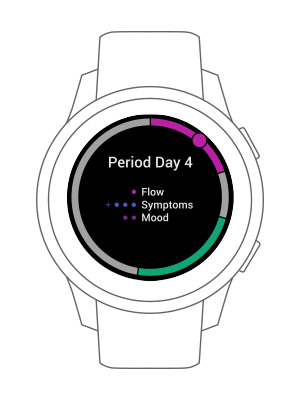
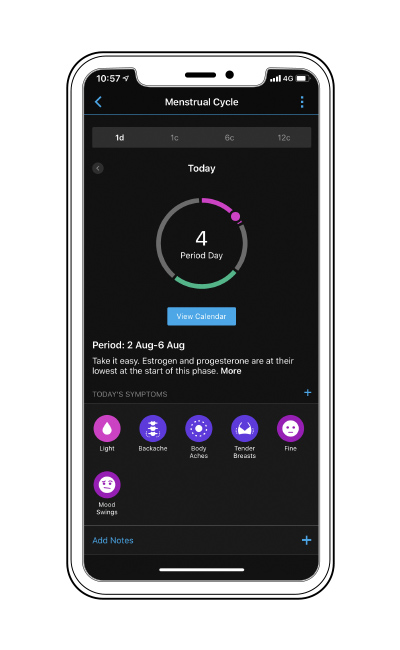
Menstrual cycle tracking functions can predict periods of menstruation and ovulation, and also allow you to manually record associated physical phenomena such as period pain or acne. Continuous long-term monitoring is matched with features such as in-app nutritional suggestions, helping you to better understand how your body's reacts to each stage in your cycle and plan accordingly.

Women with an irregular menstural cycle or who are entering menopause can still benefit by using this function to keep track of your physical condition in a holistic fashion and to access health information.

* Garmin wearable devices and accessories are not medical products and should be used for reference purposes only. They must not be used to diagnose, treat, alleviate or predict any disease or illness. Before using, users should assess their personal physical condition and seek advice from medical professionals.

Pregnancy Tracking

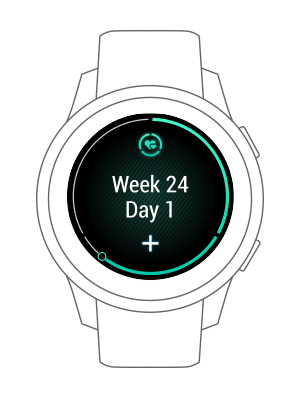
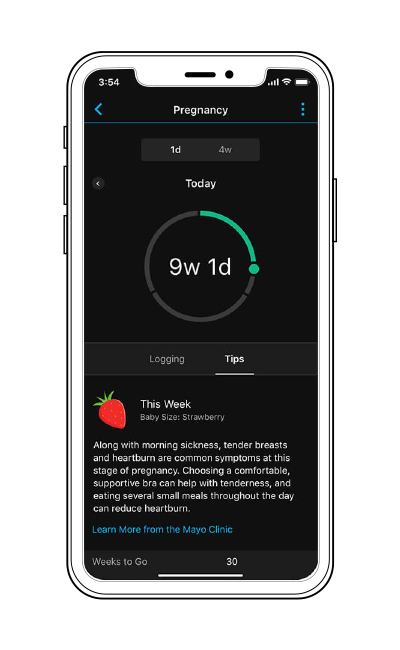
If you’re currently pregnant, you can select Pregnant as your cycle type in the Women’s Health settings. This will pause your cycle predictions (if you’re currently tracking your menstrual cycle). This includes displaying your baby’s gestational age and size, providing weekly education relating to exercise and nutrition during pregnancy and offering even more logging options from the other cycle types.

Logging and Reminder Options

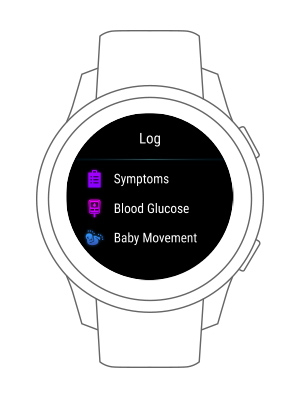
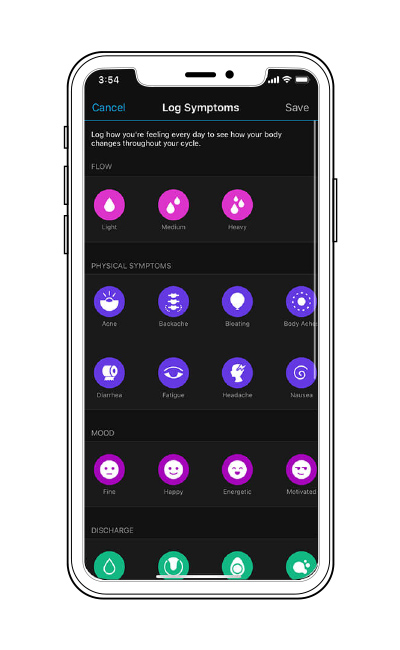
Your symptoms and logging needs may change as your pregnancy progresses, and that’s where the variety of logging options can become handy. This feature offers the following:

  • A variety of logging categories, including mood, discharge, pregnancy-specific symptoms and more
  • The ability to manually track your baby’s movement, including kicks and hiccups
  • The ability to manually enter blood glucose levels (if diagnosed with gestational diabetes) throughout the day

You can also set up customized reminders to help you keep track of hydration goals or remind you to practice your Kegels.

Fitness Tracking and VO2 Max

Fitness is more than a feeling. With the right tools it can be easily measured, and with the right perspective it can be easily managed. When health professionals talk about fitness, they are typically thinking in terms of cardiorespiratory fitness, which is measured in terms of VO2 max.

VO2 max is a single number that describes your cardiorespiratory fitness. It tracks the maximum amount of oxygen your body can utilize in a single minute of intense exercise. This information is essential for understanding your ability to fuel activity by using your aerobic energy pathways. In other words, the higher your VO2 max, the more oxygen you can import, transport and utilize to aerobically transform the energy stored in nutrients into performance.
Thinking about your fitness in terms of VO2 max — a vital health metric that is estimated by your Garmin device — has many advantages. These include knowing when you are fit enough to enjoy health benefits and when a lack of regular activity could be putting your well-being at risk.


Understand and Improve Your VO2 Max

When it comes to understanding what your VO2 max means, higher is usually better. What a good level is for you depends on factors such as age and gender. This is because of normal differences in body composition (fat versus muscles, bones and organs) and the fact that our ability to utilize oxygen typically declines as we get older.


How Garmin Estimates Your VO2 Max

Select Garmin devices automatically estimate your VO2 max each time you record a run or brisk walk with heart rate and GPS tracking activated. Over the course of your activity, the Firstbeat Analytics engine built into your device examines the relationship between how fast you’re moving and how hard your body is working to maintain that pace.
A few Garmin devices without built-in GPS are able to estimate your VO2 max using accelerometer data, by utilizing location from a paired smartphone or for cycling computers, based on GPS and power data.

Fitness Age

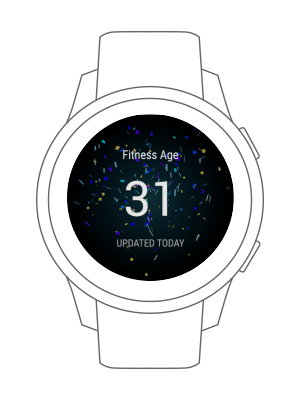
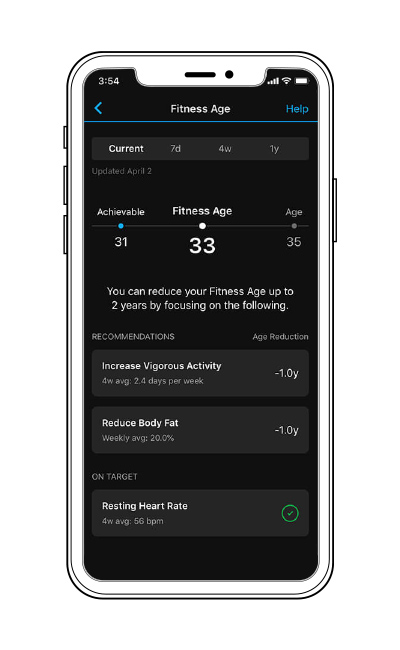
Fitness age is an estimate of how fit you are compared to your actual age. Consider the fitness age value a helpful reminder that healthy choices and regular physical activity can help you feel fresh and revitalized. And remember, if your fitness age is older than your actual age, even small steps in the right direction can have a substantial impact on how you feel.

Fitness Age Using VO2 Max

The fitness age stat is a relatable interpretation of your VO2 max estimate. It is calculated by comparing your current VO2 max fitness level to the normal values of people of different ages within your same gender.

As we age, our cardiorespiratory fitness typically declines. However, this loss of performance ability can be slowed and even reversed, to an extent, with regular physical activity.

Intensity Minutes

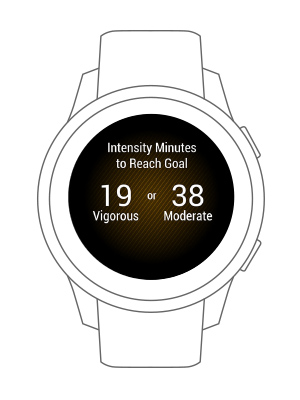
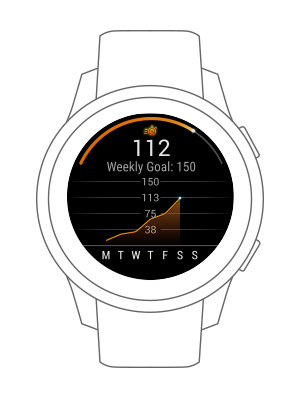
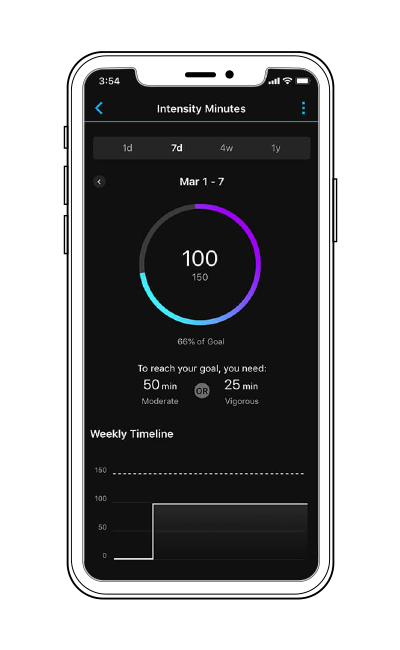
Most health organizations recommend that adults get at least 150 minutes of moderate intensity physical activity each week. Likewise, similar health benefits can be achieved by getting at least 75 minutes of vigorous intensity physical activity. There are even greater health benefits to be gained by exceeding these suggested amounts. Remember to always consult your physician or other qualified health care professional if you have concerns or questions about your health and ability to perform physical activity.

Your Garmin watch automatically tracks those moderate and vigorous activity minutes throughout the week and presents them as intensity minutes. Vigorous intensity minutes are counted twice (x2) to reflect the larger benefit they have on your body compared to moderate intensity. Garmin watches set the default target for weekly intensity minutes at 150, but you can adjust this goal based on your own personal needs.

Calories Burned

The desire to manage weight and keep track of calories are two of the most common reasons people engage with wearables and health tracking tools. Obesity is a major, independent risk factor for heart disease. The good news is that losing excess weight can make a huge difference in helping you sleep better, reducing muscle and joint pains, and reducing the chances of developing Type 2 diabetes.

Active Calories vs. Resting Calories

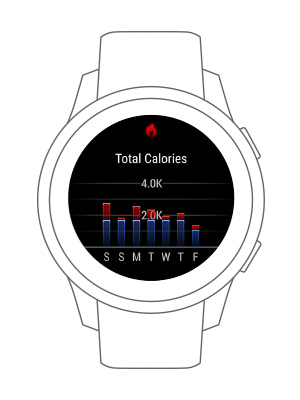
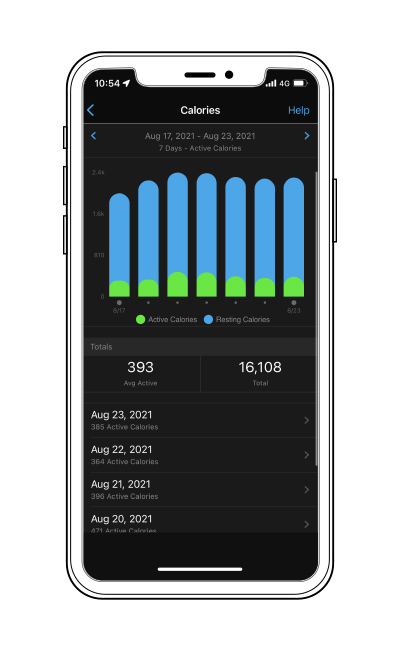
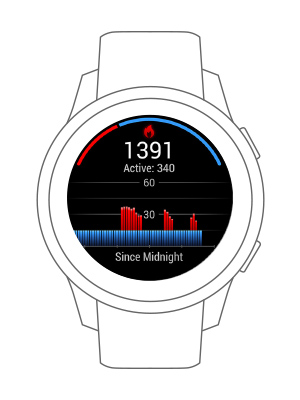
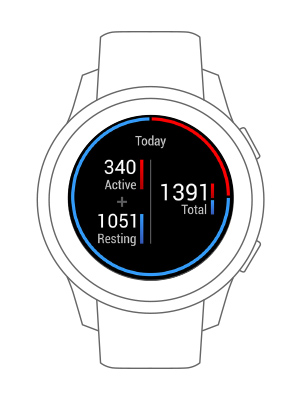
You are always burning calories. Everything you do requires some energy; even sleeping or sitting on the couch watching TV burns calories. Naturally, your body’s demand for energy increases significantly during physical activity. Metabolic activity increases along with the intensity of your efforts. Powered by Firstbeat Analytics, your Garmin device can help you understand how many calories you burn throughout the day.

When you see the term “active calories,” this refers to the calories you burned during physical activity. The other category, “resting calories,” refers to calories burned during periods of inactivity. These are the calories burned that keep your body functioning, such as breathing, circulating blood, maintaining body temperature, operating your nervous system and sleeping. Your resting calories burned is also referred to as your basal metabolic rate.

Tracking Calorie Consumption

Understanding the calories you consume each day when you eat and drink can ensure that you are eating in a way that supports your active lifestyle needs.

Hydration

Your body needs water to survive. After all, water makes up approximately 60% of your body weight. The benefits of staying hydrated cannot be overstated. They include the following:

  • Temperature regulation
  • Joint protection
  • Waste removal
  • Sensitive tissue defense
  • Weight loss promotion
  • Defense against chronic diseases

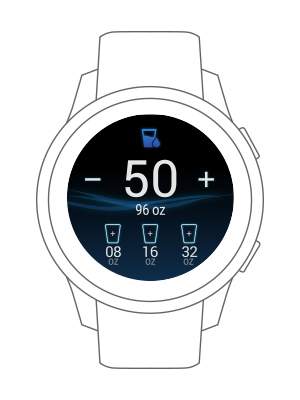
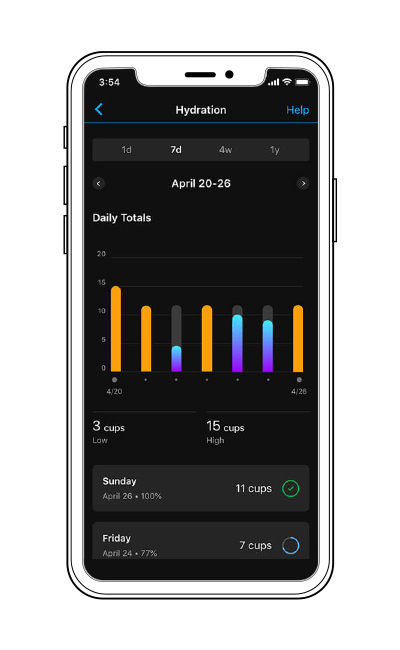
Your Garmin device will set a default daily hydration goal based on your gender. This goal is derived from the recommendations of several credible health organizations, including the U.S. National Academy of Sciences. You can use this default goal or create your own. If you choose the auto goal option, your hydration goal will increase dynamically based on estimated sweat loss for timed activities you perform. Sweat loss is estimated by analyzing exertion and the ambient temperature.